Data: September 11 to November 8, 2026, residential and mobile proxy exits from 57 providers. IP ownership, network, and connection type as of November 5, 2026.
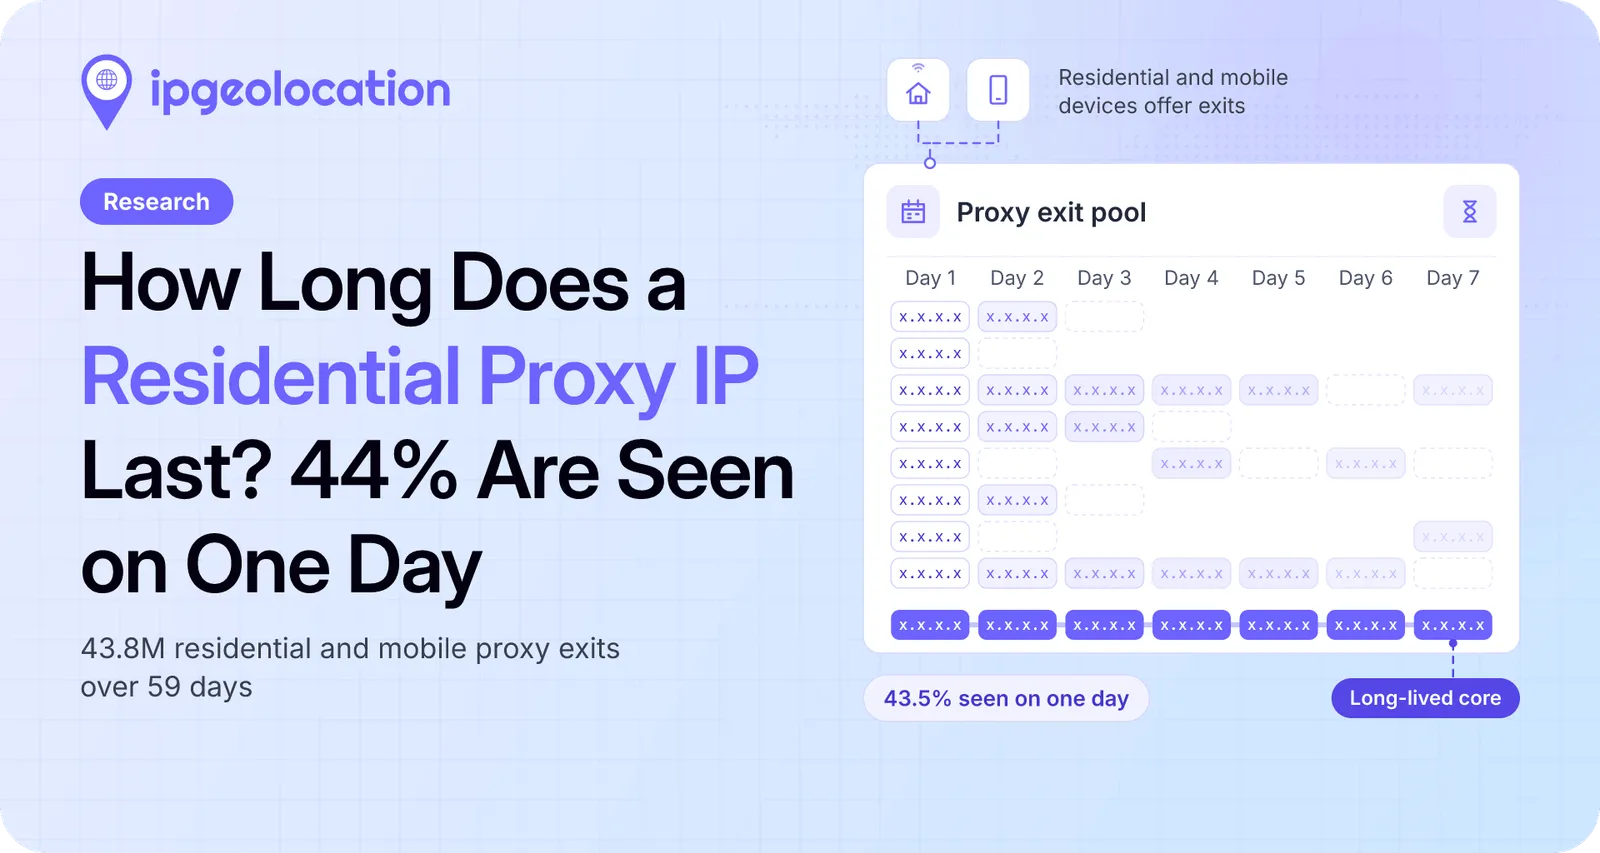
How long does a residential proxy IP last? Usually a day or two. IPGeolocation.io tracked 43.8 million residential and mobile proxy IPv4 addresses between September 11 and November 8, 2026, and 43.5% of them, more than 4 in 10, were offered as a proxy exit on only one day in that period. An exit is the address a proxy customer's traffic leaves from, and we count an address as seen on a day if any proxy provider offered it as an exit that day (UTC).
For addresses that were brand new to us in late September, half were last seen within 2 days. A smaller group stays much longer: about 1 in 4 was still turning up more than a month after it first appeared, and 10,161 addresses were on offer every single day of the 59. IPv6 addresses disappear even faster, with 91.4% seen on only one day.
This isn't the number proxy sellers give you. When sellers talk about residential proxy rotation, they mean sessions: how long one customer keeps the same exit before it switches, whether that's every request, every few minutes, or a fixed "sticky" period. Our numbers answer a different question: on how many days an address is available in proxy pools at all. Switches within a single day don't show up in them.
TL;DR
Among 12.37 million IPv4 proxy exits first seen September 11–30, 2026, half were last seen within two days of their first sighting. We followed this group through November 8. But a small group of addresses stays for weeks and makes up most of what's on offer on any given day, so a proxy list still works if it's updated daily and weighs how recently each address was seen.
- Addresses seen on 8 days or more were only 16.3% of all addresses, but 62.3% of all sightings, where a sighting is one address seen on one day.
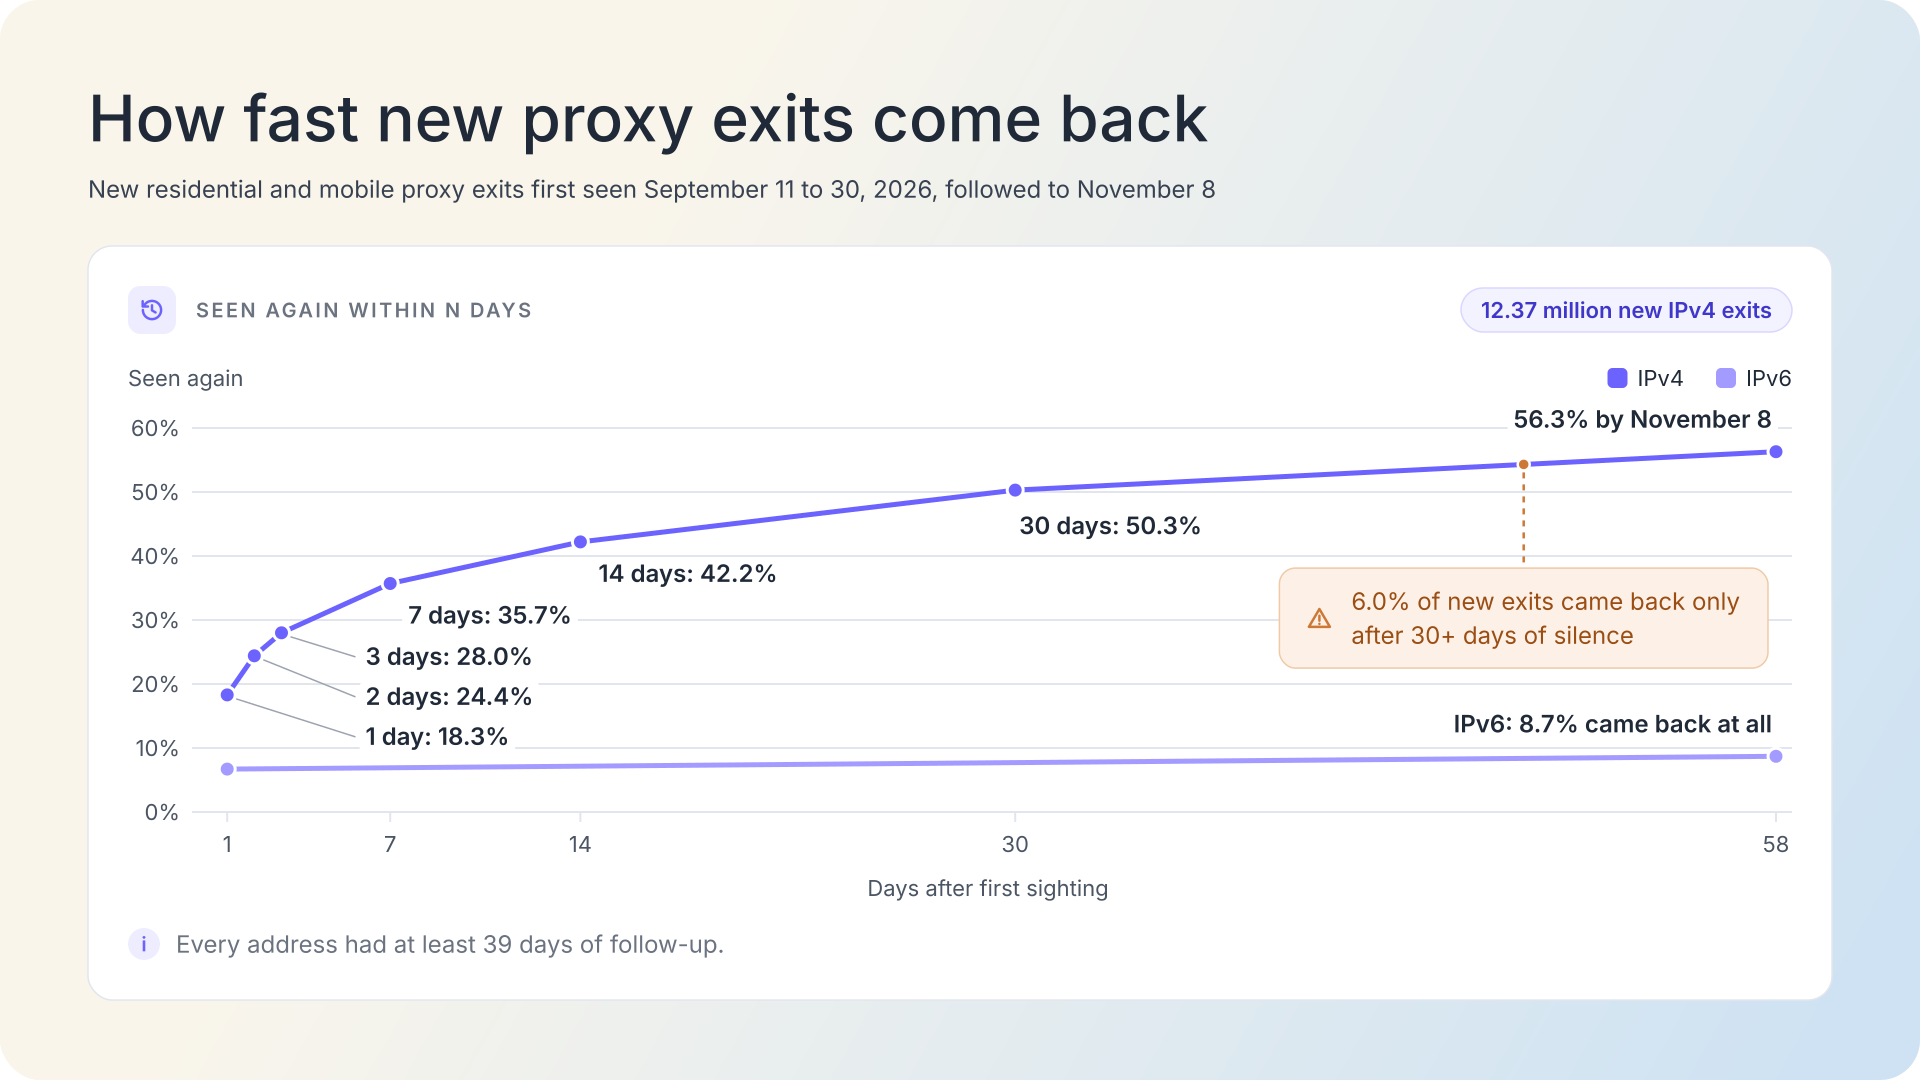
- Addresses come back: 56.3% of new addresses were offered again before November 8, most within a few days, and 6.0% returned after more than a month of silence.
- IPv6 addresses are close to single-use: 91.4% were seen on one day, and even counted by /64 block, 70.5% were.
- The network matters most: only 7.6% of addresses on T-Mobile USA's network were one-day exits, against 84.7% on Telefónica Germany's.
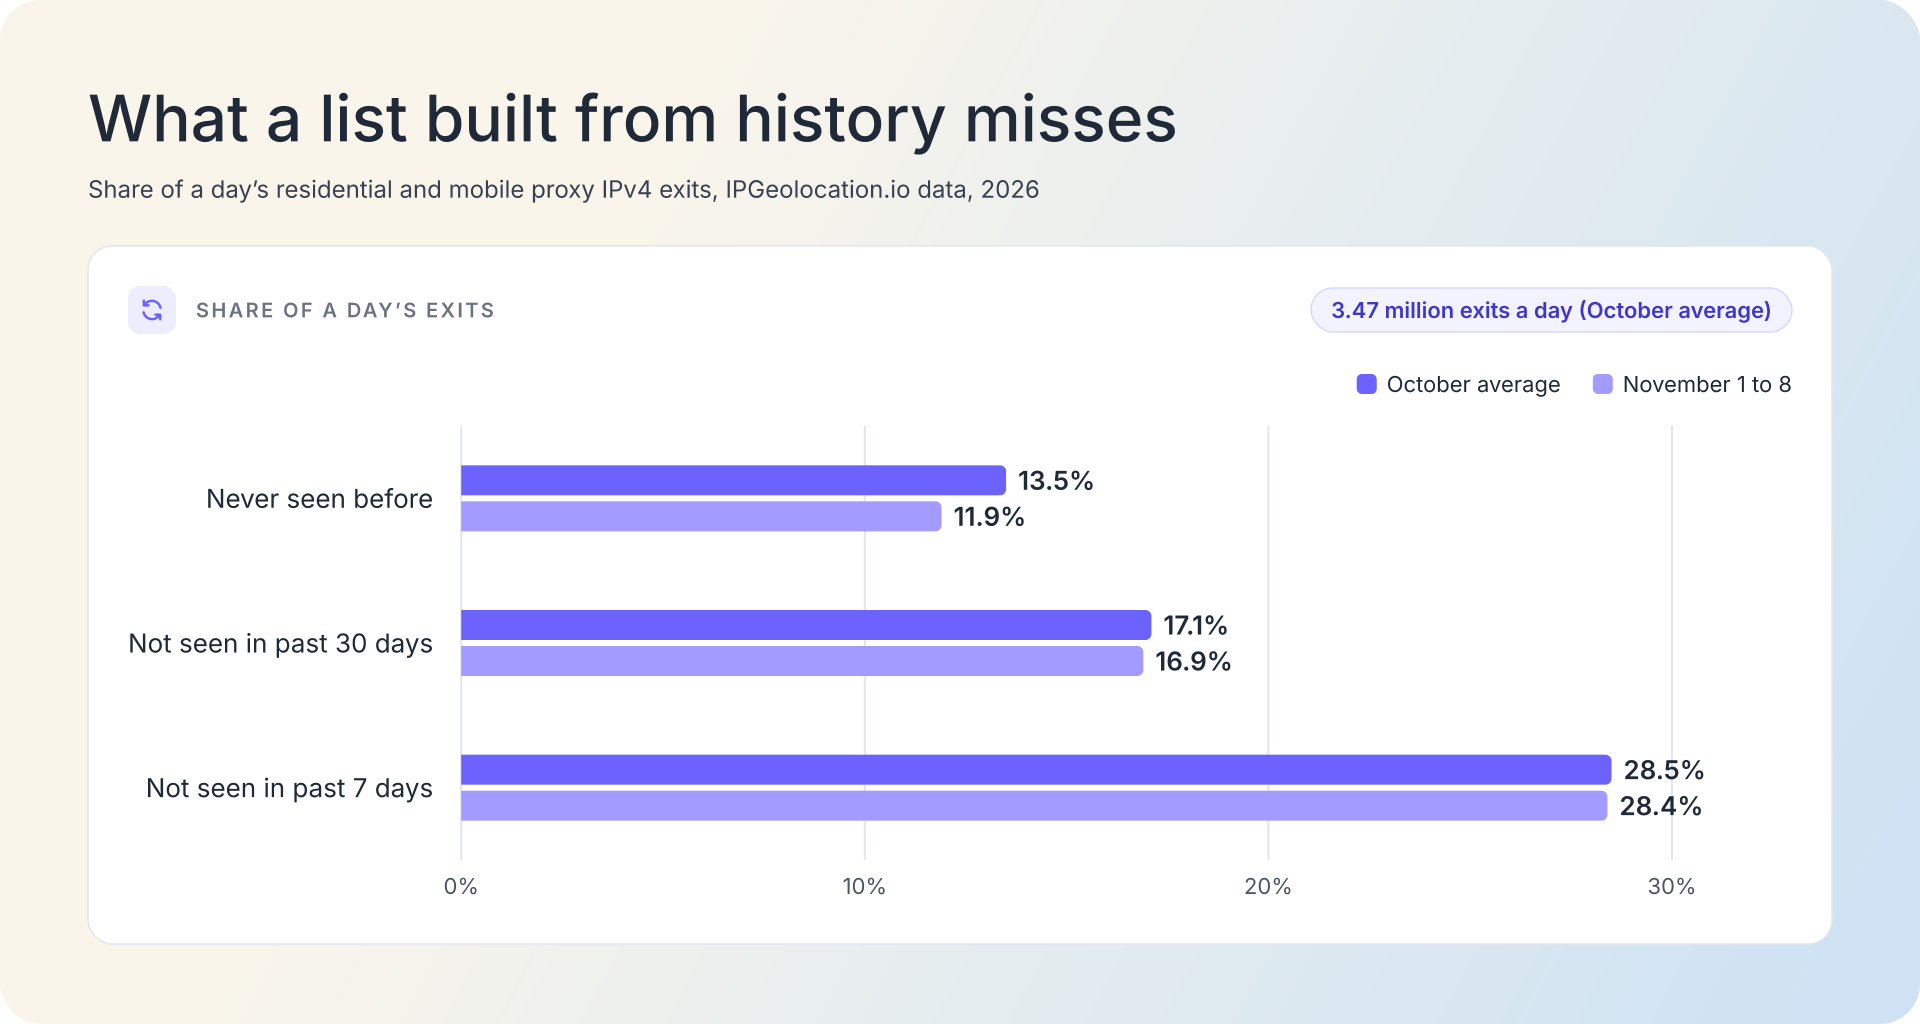
- Every day brings newcomers: on an average October day, 13.5% of the addresses on offer had never been seen before, and 28.5% hadn't been seen in the previous 7 days.
- Refresh proxy data daily, weigh when and how often an address was seen, let old flags fade slowly, and treat /24 and network history as context rather than grounds for a block.
How many days a residential proxy IP stays in the pool
Most addresses show up on very few days. This is how many of the 59 days each of the 43.82 million IPv4 addresses was offered as an exit. Read the first row as: 43.5% of all addresses were seen on one day only.
| Days Seen | Share Of Exits |
|---|---|
| 1 day | 43.5% |
| 2 days | 16.9% |
| 3 days | 8.8% |
| 4 to 7 days | 14.5% |
| 8 to 30 days | 14.1% |
| 31 to 59 days | 2.2% |
On average, an address was seen on 4.73 of the 59 days, and only 10,161 were seen on all of them.
Counting days can undercount how long an address hangs around, because many addresses come and go. Measured from the first day an address was seen in the window (September 11, 2026, at the earliest) to the last (November 8, 2026, at the latest), 22.9% stretched over more than a month, even though only 2.2% were seen on more than 30 separate days.
Is the 43.5% a side effect of the 59-day window? An address that first appeared on November 8, the last day, had no chance to be seen twice. So we checked it two other ways:
- Of the 12.37 million addresses that were brand new to us between September 11 and 30, each with at least 39 days to show up again, 43.7% never did.
- Of all 55.8 million IPv4 addresses seen since February 1, 2026, 43.3% appeared on only one day.
All three measures land at about 44%.
Those brand-new addresses also show how long a typical address lasts from its first sighting to its last. Half were last seen within 2 days of their first sighting, three in four within 28 days, and nine in ten within 45 days. About 1 in 4 (23.7%) was last seen more than 30 days after it first appeared. On average, a new address was seen on 3.46 days.
Addresses with a past were much steadier. Of the addresses we had already seen before September 11, only 20.7% were one-day exits in the window, compared with 53.6% of brand-new ones.
Why proxy lists still work: the long-lived few fill most days
If most addresses vanish in a day or two, how can a list of proxy addresses be any use? Because the addresses that stick around show up day after day, so they fill most of each day's pool, while short-lived addresses each take a single day and are gone.
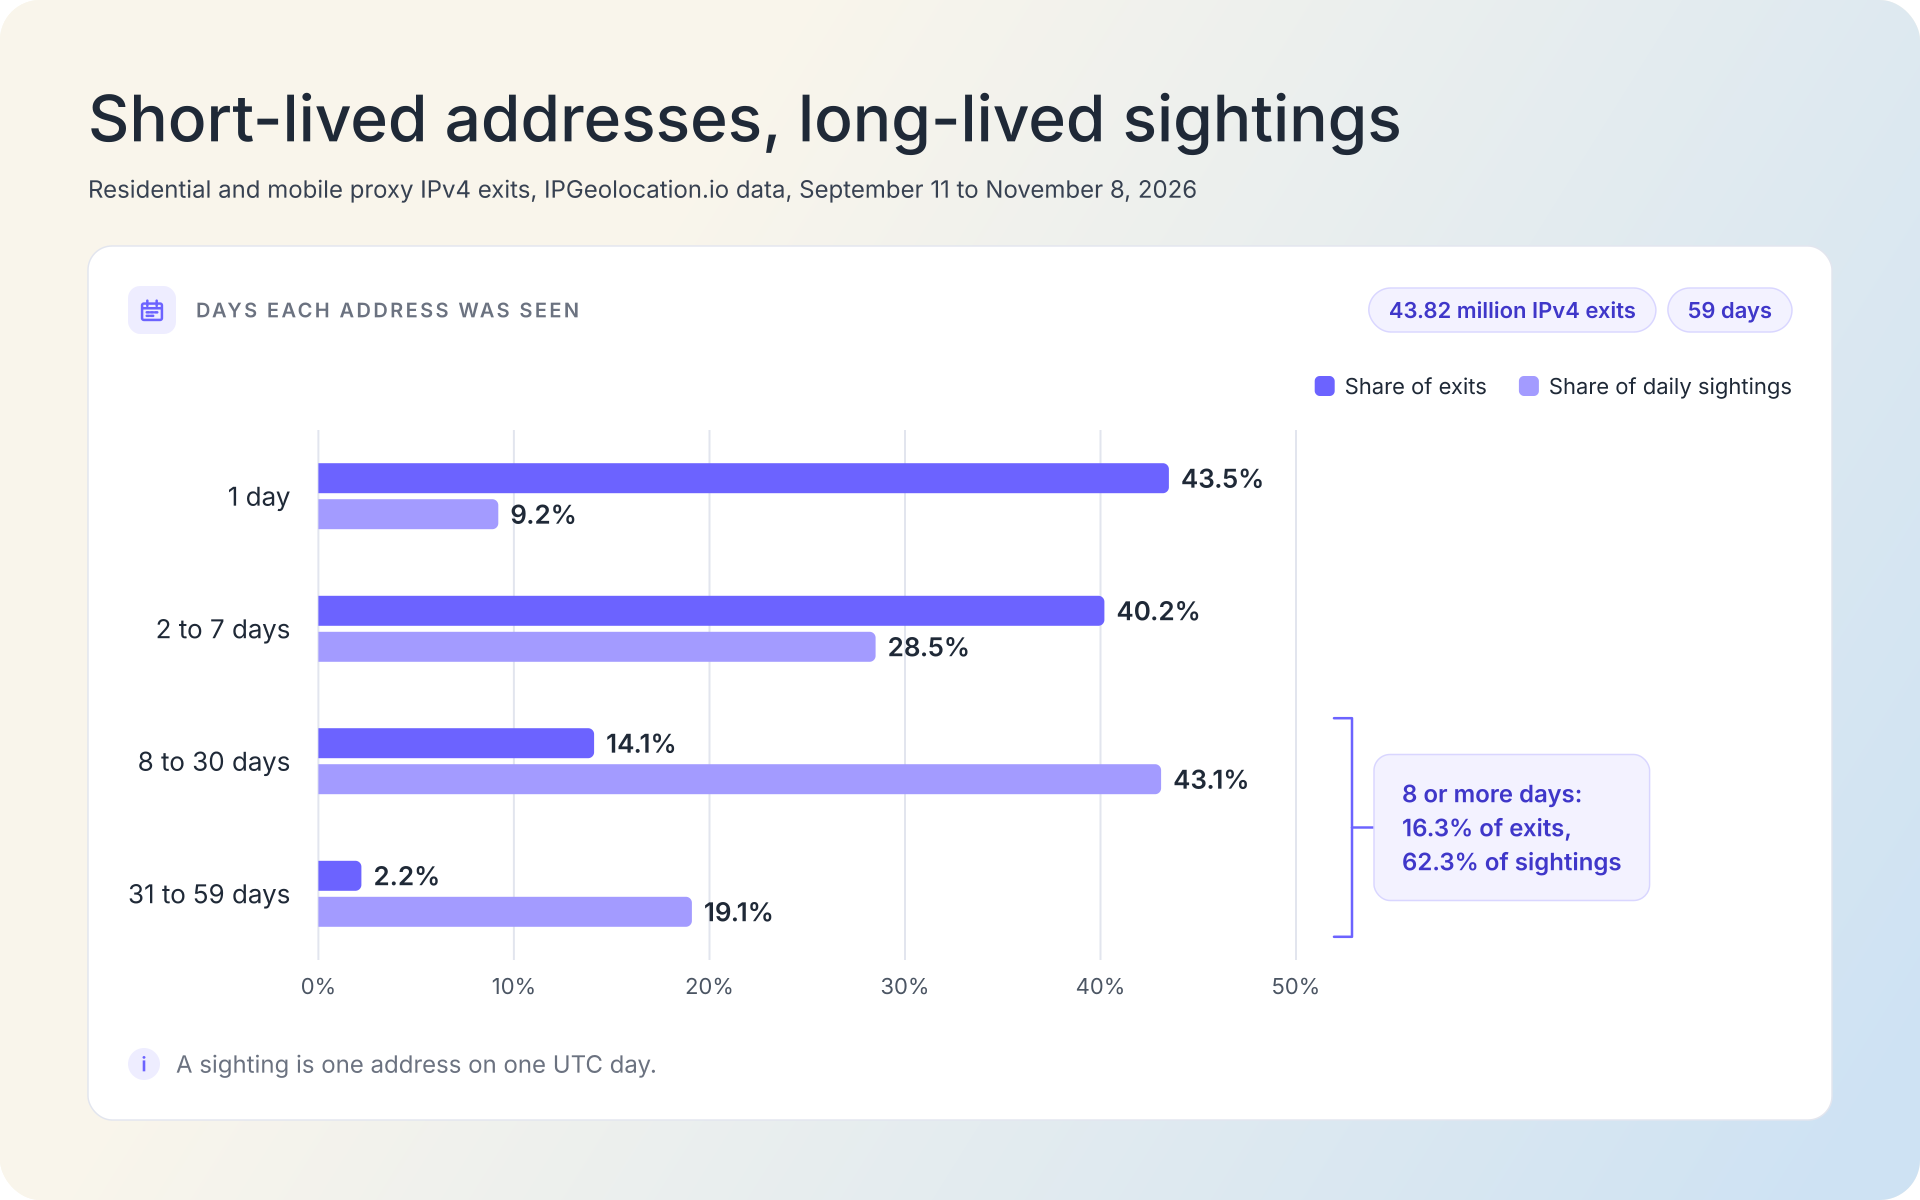
Count every day an address was on offer as one sighting. In IPGeolocation.io's data for September 11 to November 8, 2026, the 16.3% of addresses seen on 8 days or more made up 62.3% of all sightings, while the 43.5% seen on only one day made up only 9.2%. Read each row as the group's share of all addresses next to its share of all sightings:
| Days Seen | Share Of Addresses | Share Of Sightings |
|---|---|---|
| 1 day | 43.5% | 9.2% |
| 2 to 7 days | 40.2% | 28.5% |
| 8 to 30 days | 14.1% | 43.1% |
| 31 to 59 days | 2.2% | 19.1% |
Part of that is simple counting, since an address seen on more days adds more sightings. A daily check doesn't depend on it. On an average October day, 42% of the addresses on offer had also been on offer the day before, 71.5% at some point in the previous 7 days, and 82.9% in the previous 30. In other words, most of today's proxy addresses were already known from the past month. A list updated every day catches yesterday's newcomers, and its history covers the regulars.
Do residential proxy IPs come back?
More than half do, usually within a few days. Take the 12.37 million addresses that were brand new between September 11 and 30: by November 8, 56.3% had been offered again. Read the table as the share that had come back within each number of days:
| Seen Again Within | Share Of New Addresses |
|---|---|
| 1 day | 18.3% |
| 2 days | 24.4% |
| 3 days | 28.0% |
| 7 days | 35.7% |
| 14 days | 42.2% |
| 30 days | 50.3% |
| By November 8 | 56.3% |
Of the addresses that returned, the typical gap before the second sighting was 4 days. But 6.0% of all the new addresses came back only after more than a month with no sighting at all. So an address that has been quiet for a month is quiet, which isn't the same as clean.
A returning address isn't necessarily the same device, either. On a connection whose address changes, the internet provider can hand that address to another customer who also runs proxy software. What the data shows is that the address went back into a proxy pool.
IPv6 proxy exits are almost all single-use
IPv6 addresses barely repeat. Of 15.80 million IPv6 residential and mobile proxy addresses IPGeolocation.io saw between September 11 and November 8, 2026, 91.4% appeared on only one day, and only 0.3% on 7 days or more. Only 8.7% of new IPv6 addresses ever came back, 76.5% of those on the very next day. On an average October day, 86.5% of the IPv6 addresses on offer had never been seen before.
Two things about IPv6 help explain it. Many devices regularly switch to a fresh "privacy" address, and the standard's default is a new one each day (RFC 8981, temporary address extensions for IPv6). And a home connection usually gets a large block of IPv6 addresses, so a device has plenty to move between. Looking at /64 blocks, one local network's worth of addresses (a household is often given many), helps only a little: 70.5% of the 7.71 million /64 blocks were active on only one day.
For IPv6, tracking single addresses is close to useless, and tracking /64 blocks only partly helps. Combine the block with the network and how recently it was active.
Why some proxy IPs last a day and others for months
It depends mostly on how the internet provider hands out addresses. If one-day addresses were a quirk of how we measure, every network would look about the same. They don't: on some networks, each identified by its autonomous system number (ASN), only 7.6% of proxy addresses were one-day exits, and on others 84.7% were.
1. Connection type
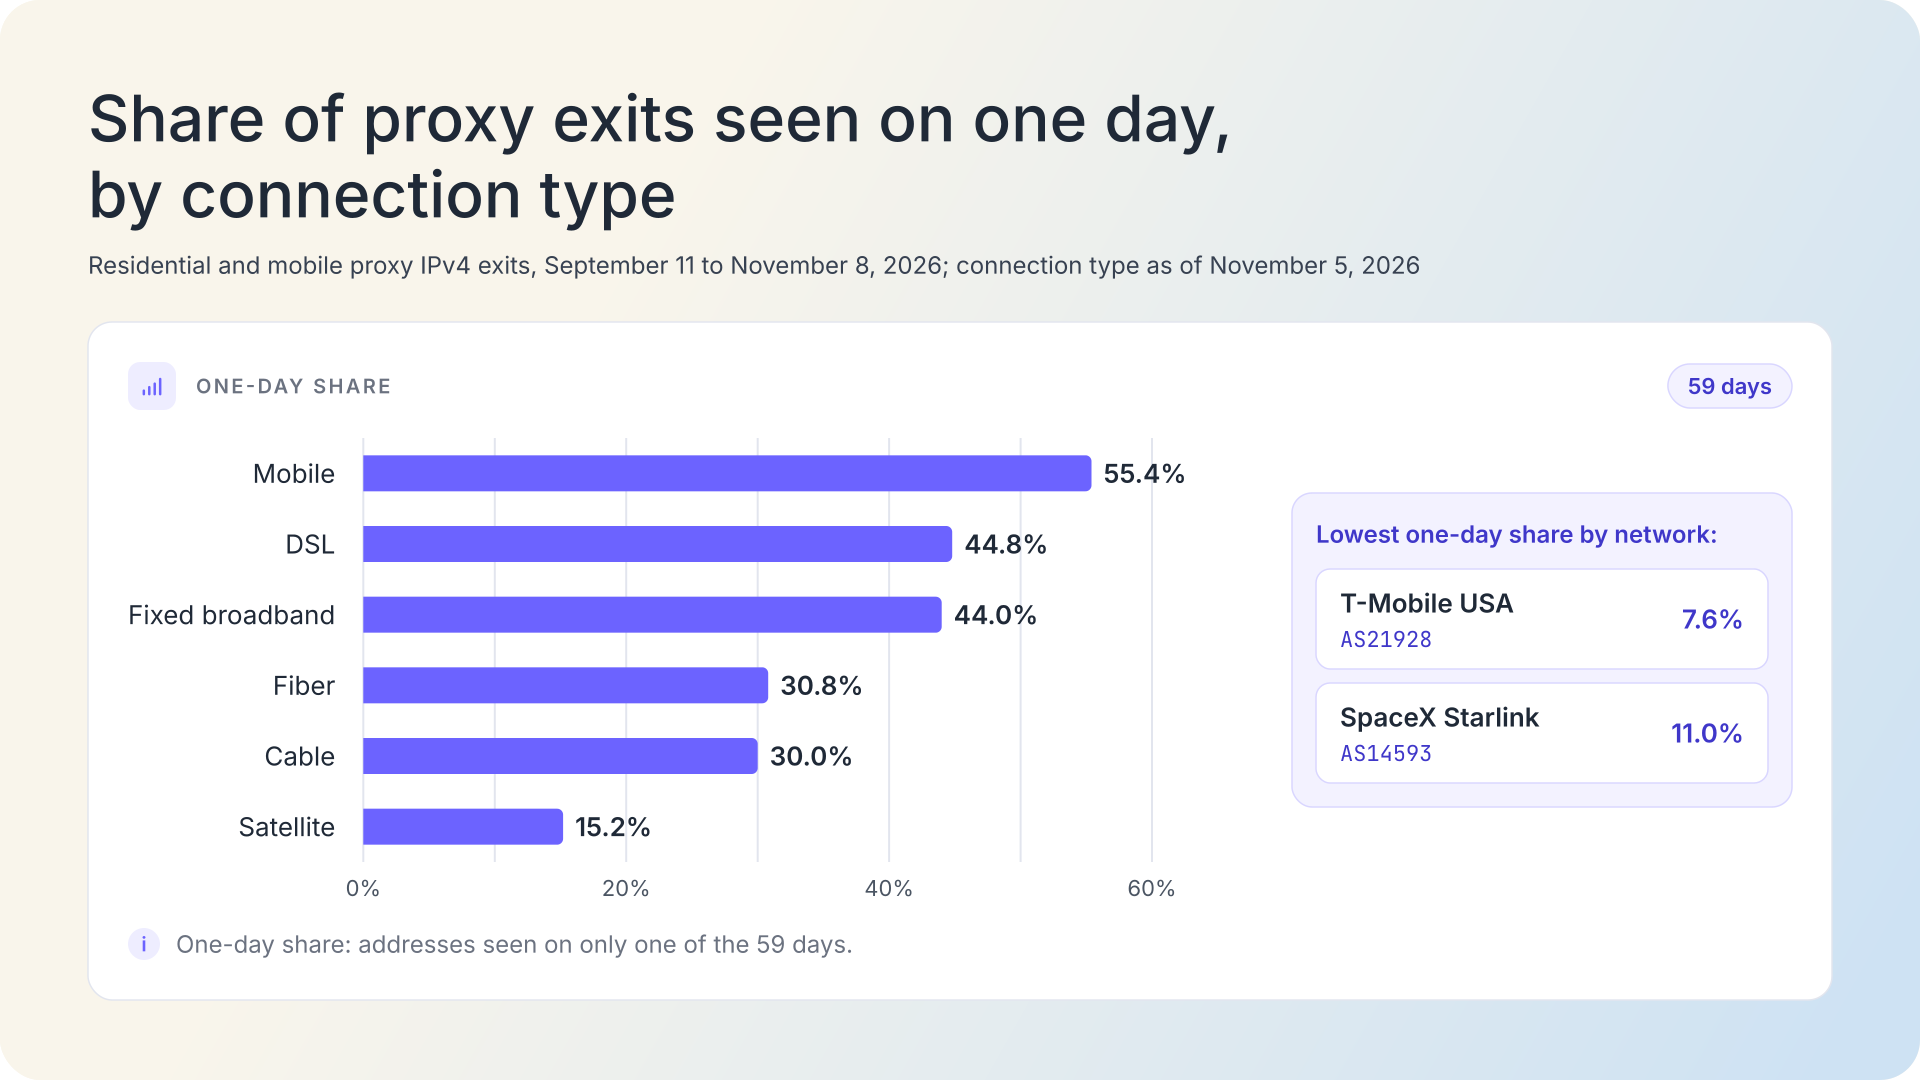
The type of connection matters too. (In the tables, K means thousand and M means million.) Read the first row as: of the 4.3 million addresses on mobile connections, 55.4% were seen on only one day and 7.4% on 8 days or more.
| Connection Type | Addresses | One Day | 8+ Days |
|---|---|---|---|
| Mobile | 4.30M | 55.4% | 7.4% |
| DSL | 6.97M | 44.8% | 13.1% |
| Fixed broadband | 4.57M | 44.0% | 14.1% |
| Fiber | 1.10M | 30.8% | 29.0% |
| Cable | 2.39M | 30.0% | 29.5% |
| Satellite | 234K | 15.2% | 41.7% |
Mobile addresses changed fastest and satellite addresses slowest. The labels providers sell under point the same way: the roughly 564,000 addresses sold only as mobile proxies were one-day exits 81.4% of the time, against 44.0% for addresses sold only as residential proxies.
2. Frequent reassignment makes one-day exits
How often IP addresses change on a home connection is up to the internet provider. Some give a home a new address every time the connection restarts, others on a fixed schedule (static and dynamic IP addresses explains the two kinds). A study of why dynamic addresses change, based on 3,038 RIPE Atlas probes whose addresses changed in 2015, found 20 providers that did this on a fixed schedule, usually every 24 hours or a multiple of it, with Deutsche Telekom changing addresses every 24 hours. When that happens, one device running proxy software shows up under a new address each day and leaves a trail of one-day addresses behind it.
IPGeolocation.io's data shows the result on each network. In the network tables, "One day" is the share of a network's proxy addresses seen on only one day, and "7+ days" the share seen on 7 days or more. On these networks, almost no address lasted a week:
| Network | ASN | Addresses | One Day | 7+ Days |
|---|---|---|---|---|
| Telefónica Germany | AS6805 | 201K | 84.7% | 0.7% |
| BSNL (India) | AS9829 | 574K | 83.6% | 0.7% |
| ANTEL (Uruguay) | AS6057 | 401K | 74.1% | 0.1% |
| Wind Tre (Italy) | AS1267 | 268K | 70.0% | 5.2% |
| PTCL (Pakistan) | AS17557 | 402K | 69.9% | 2.3% |
| Deutsche Telekom | AS3320 | 281K | 66.6% | 7.1% |
| Bharti Airtel (India) | AS45609 | 374K | 66.4% | 0.2% |
| Algérie Télécom | AS36947 | 1.46M | 65.1% | 0.5% |
| Telecom Egypt | AS8452 | 1.41M | 62.4% | 2.1% |
By country, 64.7% of proxy addresses in Germany were seen on only one day, against 27.4% in the United States, where the same 2015 study found no provider that changed addresses on a regular schedule. Each network's routes and type are on its ASN page, for example AS3320 for Deutsche Telekom.
3. Stable or shared addresses make long-lived exits
At the other end are networks that let a customer keep an address for a long time, or put many customers behind one address. With carrier-grade NAT, a provider shares one public address among many customers, so that address keeps showing up as a proxy exit as long as any one of them runs proxy software. Starlink's support page on the IP addresses it provides says its default IPv4 setup uses carrier-grade NAT, and only 11.0% of the proxy addresses on its network were one-day exits. Cable networks such as Comcast and Charter look similar:
| Network | ASN | Addresses | One Day | 7+ Days |
|---|---|---|---|---|
| T-Mobile USA | AS21928 | 109K | 7.6% | 62.1% |
| SpaceX Starlink | AS14593 | 181K | 11.0% | 51.9% |
| Beeline (Russia) | AS8402 | 123K | 19.8% | 29.8% |
| Verizon Business | AS701 | 179K | 23.9% | 41.1% |
| Virgin Media | AS5089 | 171K | 24.0% | 38.1% |
| PLDT (Philippines) | AS9299 | 438K | 24.1% | 37.7% |
| Charter | AS20115 | 112K | 25.0% | 36.2% |
| Comcast | AS7922 | 485K | 25.9% | 36.0% |
T-Mobile USA's network (AS21928) is the extreme case: only 7.6% of its proxy addresses were one-day exits, and 62.1% lasted 7 days or more. So "mobile" on its own says little about how long an address lasts. These long-lived shared addresses are also the hardest to act on, because blocking one blocks every customer behind it.
The address changes, the network block doesn't
A single address may vanish after a day, but the block of 256 addresses around it, called a /24 (what a /24 block is), usually keeps producing proxy exits. Only 9.2% of the 2.90 million /24 blocks with any proxy address were active on only one day, compared with 43.5% of single addresses, and 34.0% were active on 31 days or more. Of the brand-new addresses that appeared on only one day, 93.0% sat in a /24 block that had proxy addresses on 8 days or more, and 69.8% in one active on 31 days or more.
On a home network, the 256 addresses in a /24 can belong to 256 different customers. So a block's history is useful context when judging one address, and a poor reason to block the whole /24, which would cut off every household in it.
1. When the proxy pool covers an ISP
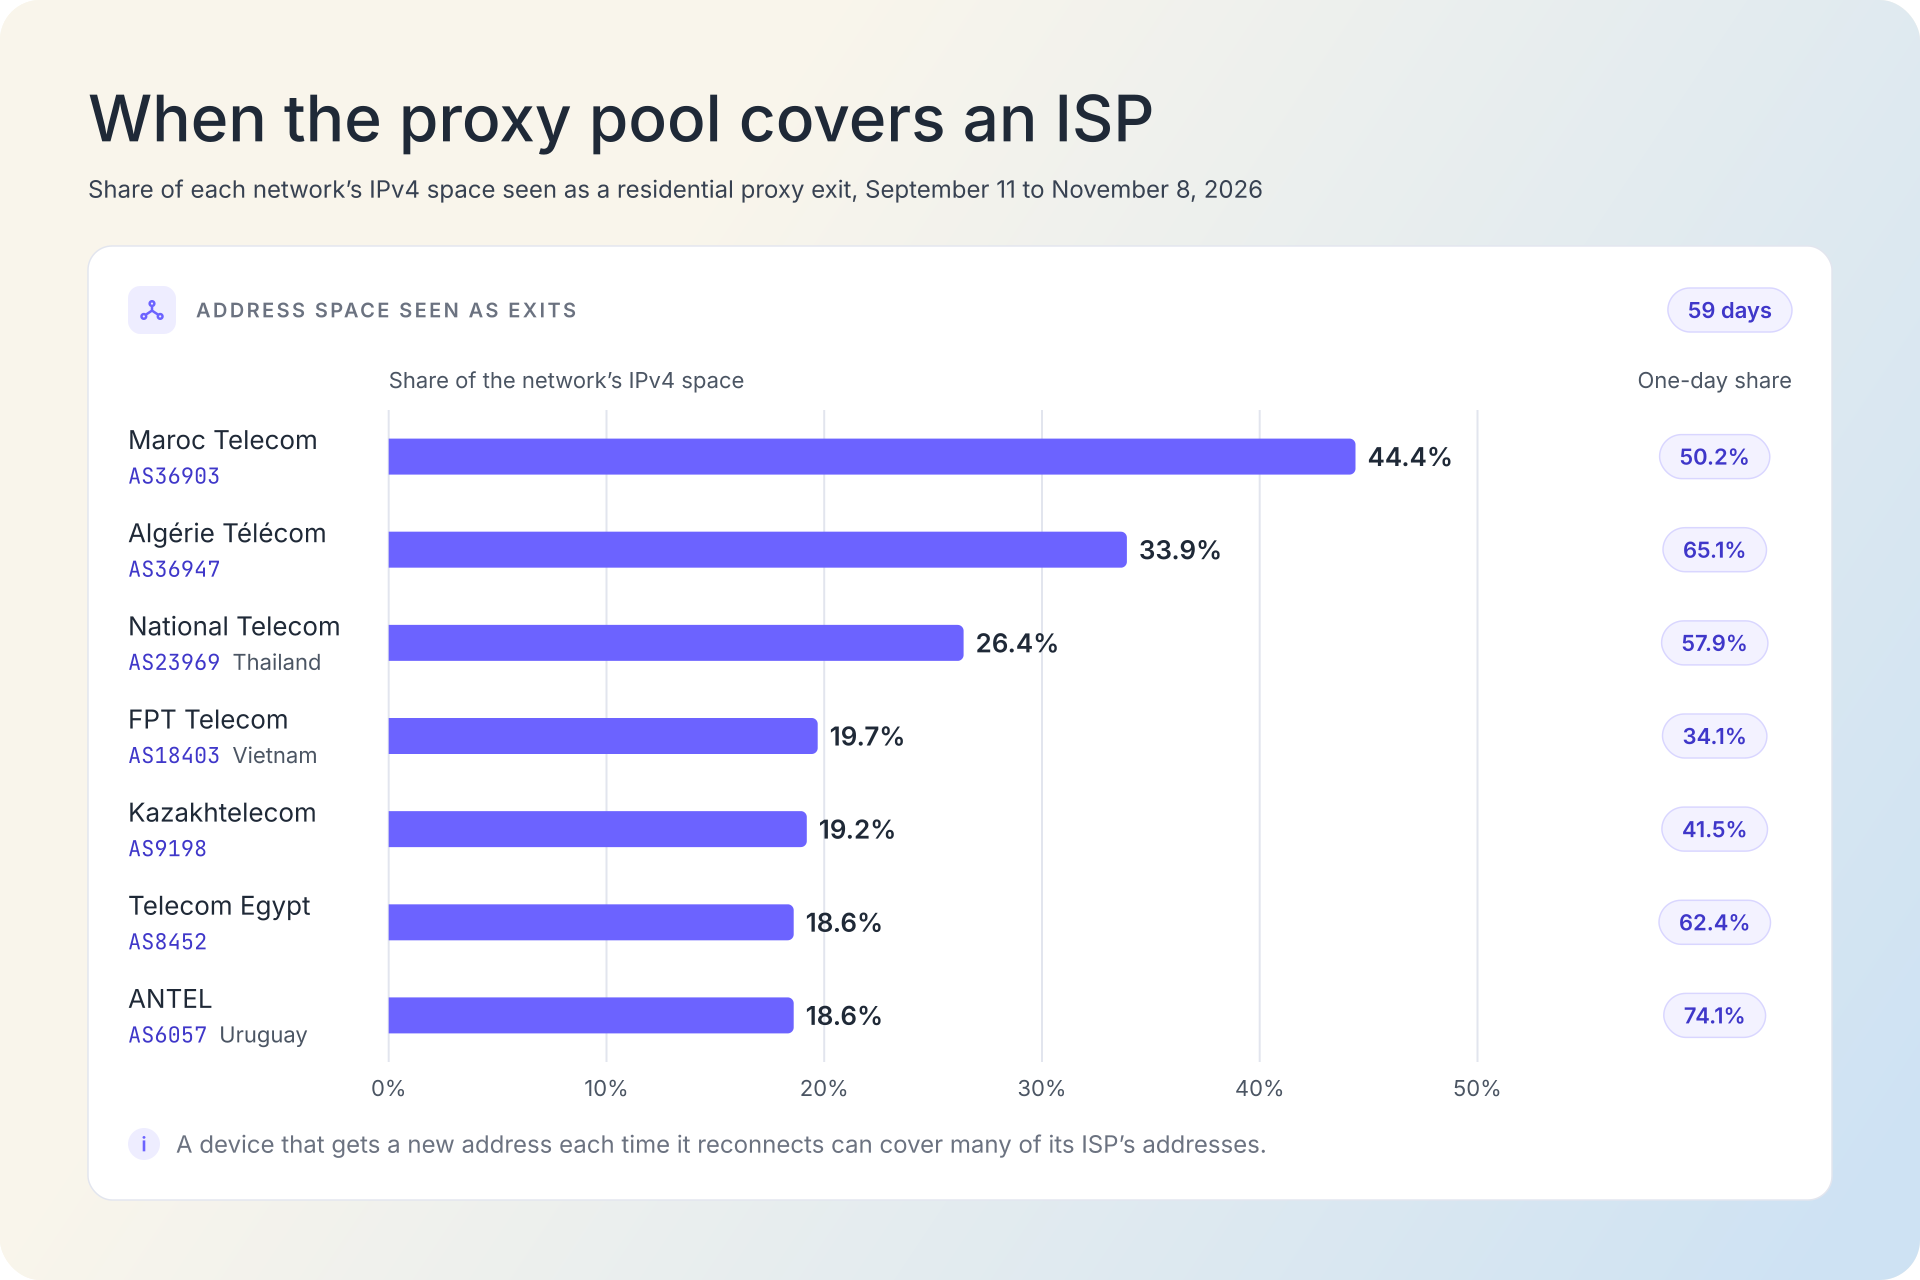
On some networks, the proxy addresses seen in 59 days add up to a big slice of all the addresses that internet provider has. Take Maroc Telecom (AS36903): IPGeolocation.io's database maps 2.49 million IPv4 addresses to it, and 1.10 million of them, 44.4%, showed up as residential proxy exits during the window. That does not mean 44% of Maroc Telecom's customers run proxy software, and the same goes for every network in the table that follows. Read each row as: the share of the network's addresses that appeared as proxy exits, then how long those exits lasted.
| Network | ASN | Space Seen As Exits | One Day | 7+ Days |
|---|---|---|---|---|
| Maroc Telecom | AS36903 | 44.4% | 50.2% | 0.3% |
| Algérie Télécom | AS36947 | 33.9% | 65.1% | 0.5% |
| National Telecom (Thailand) | AS23969 | 26.4% | 57.9% | 5.9% |
| FPT Telecom (Vietnam) | AS18403 | 19.7% | 34.1% | 14.4% |
| Kazakhtelecom | AS9198 | 19.2% | 41.5% | 17.3% |
| Telecom Egypt | AS8452 | 18.6% | 62.4% | 2.1% |
| ANTEL (Uruguay) | AS6057 | 18.6% | 74.1% | 0.1% |
Many addresses touched, almost none lasting a week: that's what frequent reassignment looks like. The likely picture is a smaller number of proxy devices that get a new address every time they reconnect and, over a few weeks, cycle through a big part of the provider's addresses.
If that's right, an address flagged yesterday on these networks may well belong to an ordinary customer today. A permanent block there risks hitting people who never ran a proxy, so how recently an address was seen matters more than whether it was ever flagged.
The persistent core: exits offered every day
At the other extreme are addresses that are on offer almost every day. IPGeolocation.io saw 10,161 IPv4 addresses on all 59 days and about 199,000 on 50 days or more. Looking back to February 1, 2026, about 49,000 addresses were seen on 100 days or more, and the record is 205 days.
These long-lived addresses are the ones many providers sell at once. 76% of the every-day addresses were offered by 30 or more providers. Providers' pools overlap a lot in general: among the 55 providers that offered at least 20,000 new addresses in late September, for the typical provider, about 94% of its new addresses were also offered by at least one other provider.
The pattern shows at both ends. 88.6% of addresses offered by a single provider were seen on only one day. No address offered by 20 or more providers was a one-day address, and 99.9% of them were seen on 8 days or more. Part of that is simple counting, since an address seen on more days has more chances to be picked up by more providers, so read it as "the long-lived addresses are the ones many providers sell", not as cause and effect.
Two examples show what these every-day addresses look like:
- 95.215.71.x, on CityLine LLC's network in Russia (AS48909), was offered on 205 of the 209 days from its first sighting on April 14, 2026, to November 8, by 52 providers.
- Five consecutive addresses in 84.108.110.x, on Bezeq International's network in Israel (AS8551), were each offered on 201 days from April 19, 2026, by 48 to 52 providers. A row of always-on addresses looks more like a fixed installation than a home connection; the data doesn't show who runs it.
Fixed business connections hold proxy exits for weeks too: in our research on residential proxy exits on government and military networks, nearly half of the addresses were offered over a span of more than 30 days.
Many 2025 exits were back in a proxy pool in 2026
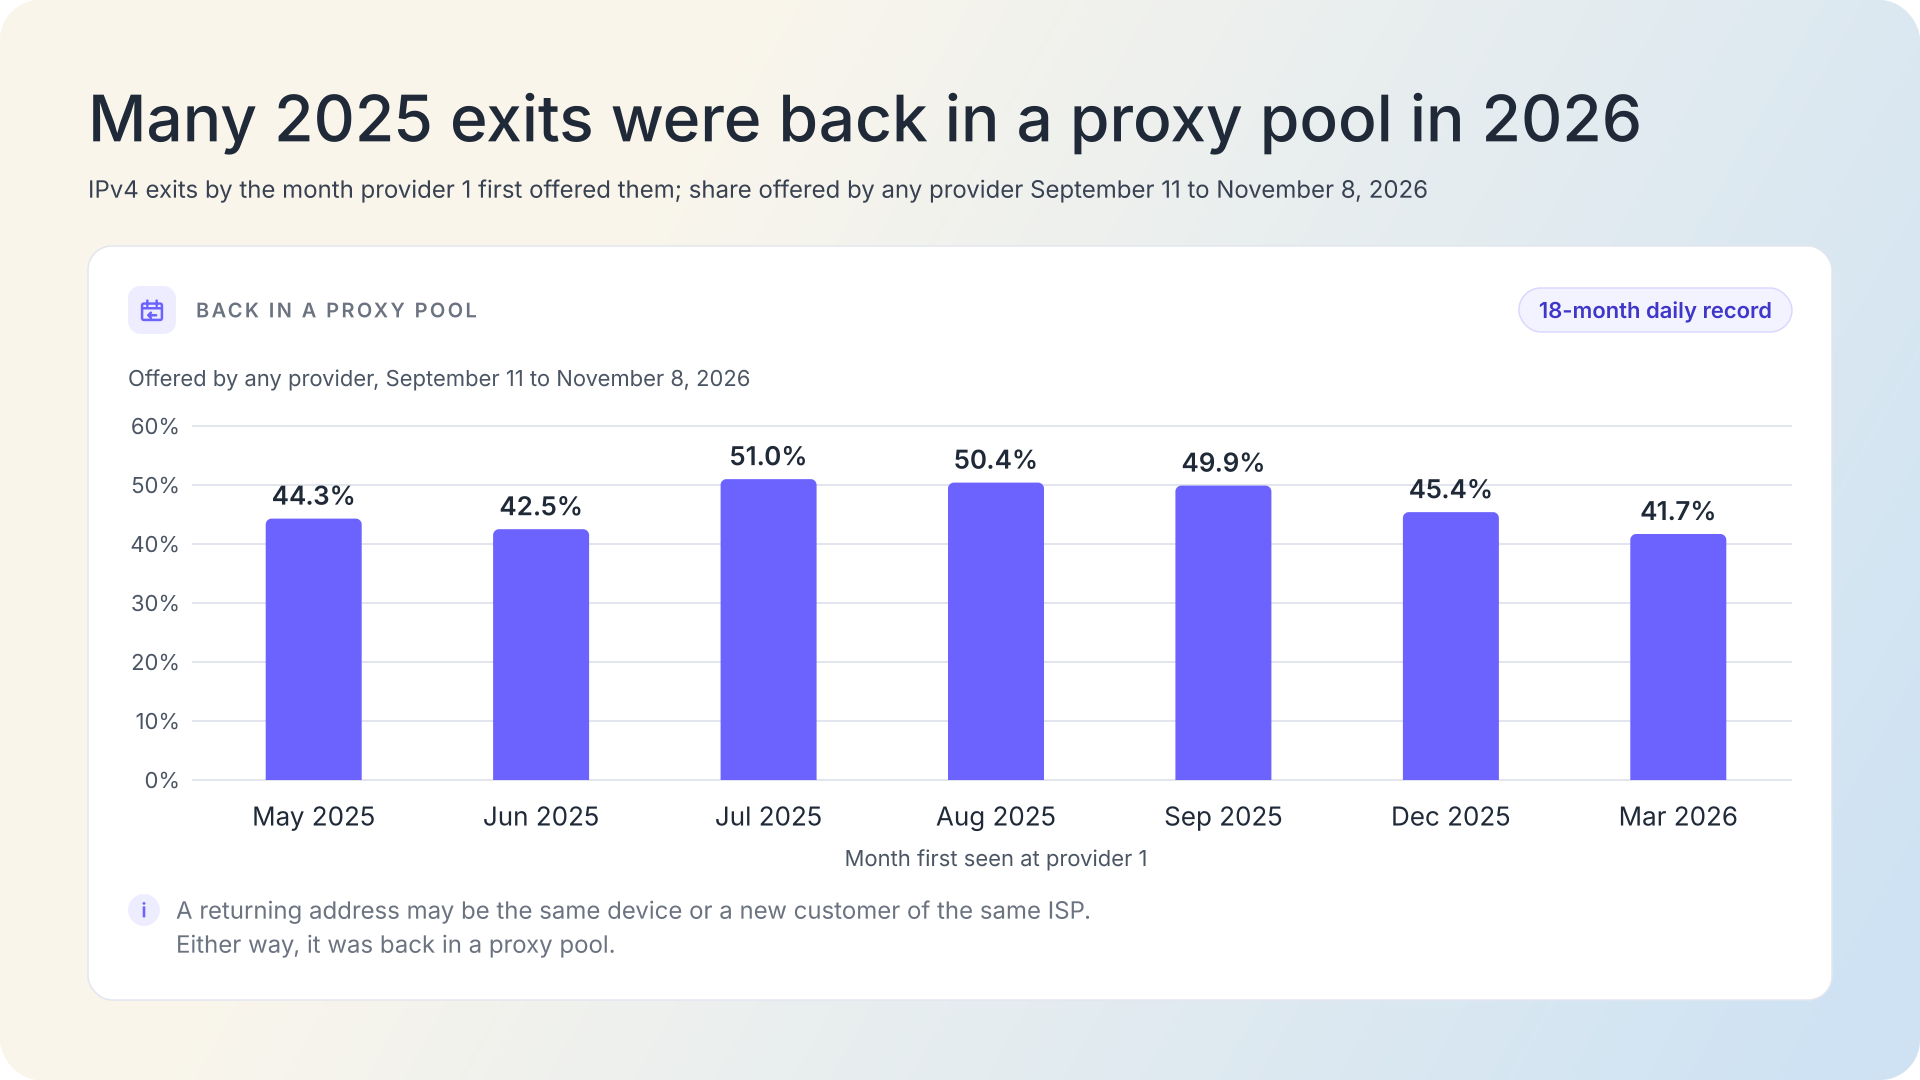
IPGeolocation.io also has 18 months of daily records for one provider ("provider 1"), starting in May 2025. We grouped its addresses by the month each first appeared and checked how many were back on offer, at any provider, between September 11 and November 8, 2026. Read the July 2025 row as: of roughly 691,000 addresses first seen that month, 38.2% were seen on only one day at the time, yet 51.0% were on offer again more than a year later. The table shows seven of the monthly groups:
| First Seen At Provider 1 | Addresses | One Day Only | Back In A Pool |
|---|---|---|---|
| May 2025 | 469K | 57.9% | 44.3% |
| June 2025 | 373K | 59.1% | 42.5% |
| July 2025 | 691K | 38.2% | 51.0% |
| August 2025 | 1.12M | 42.3% | 50.4% |
| September 2025 | 1.02M | 44.9% | 49.9% |
| December 2025 | 1.03M | 53.7% | 45.4% |
| March 2026 | 945K | 58.7% | 41.7% |
Across all 14.7 million addresses in this record, 55.9% were seen on only one day, so the ones that came back aren't a hand-picked set of stable addresses. And 17.8% of the addresses provider 1 first offered in May 2025 were offered by provider 1 again more than a year after their first sighting.
Two other providers show the same pattern on a slightly different measure. About a third of their mid-2025 addresses were seen again 180 days or more after they first appeared: 37.4% and 32.0% of provider 2's July and August groups, and 26.6% to 31.2% of provider 3's July to October groups.
Some of these comebacks may be address reassignment. On networks where a big share of addresses shows up as exits within weeks, an address can come back because the internet provider gave it to another customer who also runs proxy software. Either way, the address was back in a residential proxy pool. For a fraud team, that's an argument for keeping long history as context, given less weight as it ages, rather than deleting it.
How we measured, and what this data can't show
All figures come from IPGeolocation.io's residential proxy data for September 11 to November 8, 2026, unless a section says otherwise.
- Seen: an IPv4 or IPv6 address counts as seen on a day (UTC) if at least one residential or mobile proxy provider offered it as an exit that day. Datacenter proxy addresses are left out. "Days seen" is the number of different days.
- Window: 59 days, with addresses from 57 providers. November 9 was left out because the day wasn't over. Sightings back to February 1, 2026, are used to decide whether an address was new, for the 55.8 million check, and for the longest records in the persistent core.
- New addresses: addresses we had never seen before. The new-address group is every new IPv4 address first seen between September 11 and 30, so each had at least 39 days to show up again before November 8.
- Network data: country, ASN, and connection type come from our IP database as of November 5, 2026. A provider's address space is the IPv4 space our database maps to its ASN.
Three limits matter when reading these figures:
- An address isn't a device. One device on a changing connection uses many addresses, one shared address serves many people at once, and an address can pass to another customer over time.
- Whole days only. Switches within a single day aren't measured.
- Network data as of November 5, 2026. Country, ASN, and connection type reflect that date.
What this means for proxy data
Proxy data still works against residential proxies, but only when it's fresh and weighted. This is how much of a typical day's IPv4 proxy addresses a list built from past sightings would miss:
| Measure | October Average | November 1 To 8 |
|---|---|---|
| Addresses on offer a day | 3.47 million | 3.68 million |
| Never seen before | 13.5% | 11.9% |
| Not seen in past 30 days | 17.1% | 16.9% |
| Not seen in past 7 days | 28.5% | 28.4% |
So a list built only from the last 7 days misses more than a quarter of today's addresses, and a list built from the last 30 days misses about a sixth. Even a list with every address seen since February 1 misses the 13.5% that are brand new, roughly 468,000 addresses on a typical October day.
Here is what we'd do with those numbers:
- Refresh proxy data daily. A list can't know any address that first appeared after its last update, and newcomers made up 13.5% of an average October day. How often our IP data is updated covers our own update schedule.
- Weigh recency and frequency, not a yes or no flag. Three facts separate the regulars from one-off addresses: when an address was last seen, on how many of the last 7 and 30 days it was seen, and how many providers offered it. IPGeolocation.io's IP Security API returns these as
proxy_last_seen,proxy_days_seen_7d,proxy_days_seen_30d, andproxy_provider_count_30d(IP Security API field reference), and turning confidence and recency into an action covers how hard to push on each. - Let old flags fade slowly instead of deleting them on a timer. Give an address less weight as it goes quiet, faster on networks that change addresses often and for IPv6. A month of silence isn't enough to drop it: 6.0% of new addresses came back after one.
- Use block and network history as context, never as a blanket block. Most one-day addresses sat in a /24 that kept producing proxy exits, which helps when judging a single address. But a /24 holds up to 256 customers, and a carrier-grade NAT address can stand for many more.
- Track IPv6 by block and network. A per-address IP blocklist barely works when nine in ten IPv6 proxy addresses appear once.
- Weigh the cost of a false positive. Where proxy addresses cover a big share of a provider's addresses, last week's flag may well point at someone else today. How proxy flags turn into false positives walks through the common cases.
- Test the live connection for addresses nobody has seen. No list holds an address on the day it first appears, so that 13.5% can only be judged by how the connection itself behaves.
How IPGeolocation.io tracks proxy exits
IPGeolocation.io sells IP data, and the residential proxy data behind this research is part of it. Our APIs and databases cover geolocation, security (VPN, proxy, residential proxy, and Tor detection with a threat score), ASN, company, abuse contact, time zone, and user agent data.
For proxy decisions, every flag comes with its evidence. The Proxy & VPN Detection API returns is_residential_proxy, the names of the proxy providers seen using an address, a confidence score, and the last-seen, days-seen, and provider-count fields, for one address or up to 50,000 in a bulk call. The IP Security Database carries the same fields for local lookups and is updated daily, and the Residential Proxy Database lists residential proxy ranges with the provider name and last-seen date.
For exits no list has seen yet, Real-Time Proxy & VPN Detection tests the live connection in the visitor's browser and returns VPN and proxy scores with a confidence value, without depending on the address's history. In our testing its classification accuracy is around 98%, and the sessions it read wrongly all came back with low confidence. Compare API plans and pricing to see which plan fits your volume.
Frequently asked questions
Usually a day or two. Of 43.8 million residential and mobile proxy IPv4 exits IPGeolocation.io saw from September 11 to November 8, 2026, 43.5% were offered on only one day. Of the 12.37 million new exits first seen September 11–30, half were last seen within 2 days, and about 1 in 4 was seen again more than 30 days after it first appeared.
It depends on which clock you mean. A proxy session lasts as long as the provider's session setting allows, from a single request to days or weeks on a static plan. The address behind it is a separate question: in IPGeolocation.io's data, half of the new residential proxy exits first seen September 11–30, 2026, were last seen within 2 days.
Yes, often. 56.3% of the new IPv4 exits IPGeolocation.io first saw between September 11 and 30, 2026, were offered again by November 8, with a median gap of 4 days, and 6.0% came back only after more than 30 days of silence. A returning address isn't necessarily the same device.
As long as the list that blocked it decides, and for residential proxy exits a long block can land on the wrong person. In IPGeolocation.io's data, 43.5% of residential proxy exits were offered on only one day, so on networks that reassign addresses often, last week's proxy address may belong to an ordinary customer today. How long a bad IP reputation lasts covers how lists expire entries.
Most of them, with fresh data. In IPGeolocation.io's data, 82.9% of the residential proxy exits on an average day in October 2026 had been seen in the previous 30 days, so current proxy data recognizes most of them. The 13.5% never seen before can't be on any list and need a test of the live connection. How residential proxy detection works explains the methods.
Updates
- First published with data from September 11 to November 8, 2026.